Making a Log Viewer 12× Faster: A Go Optimization Guide
TL;DR
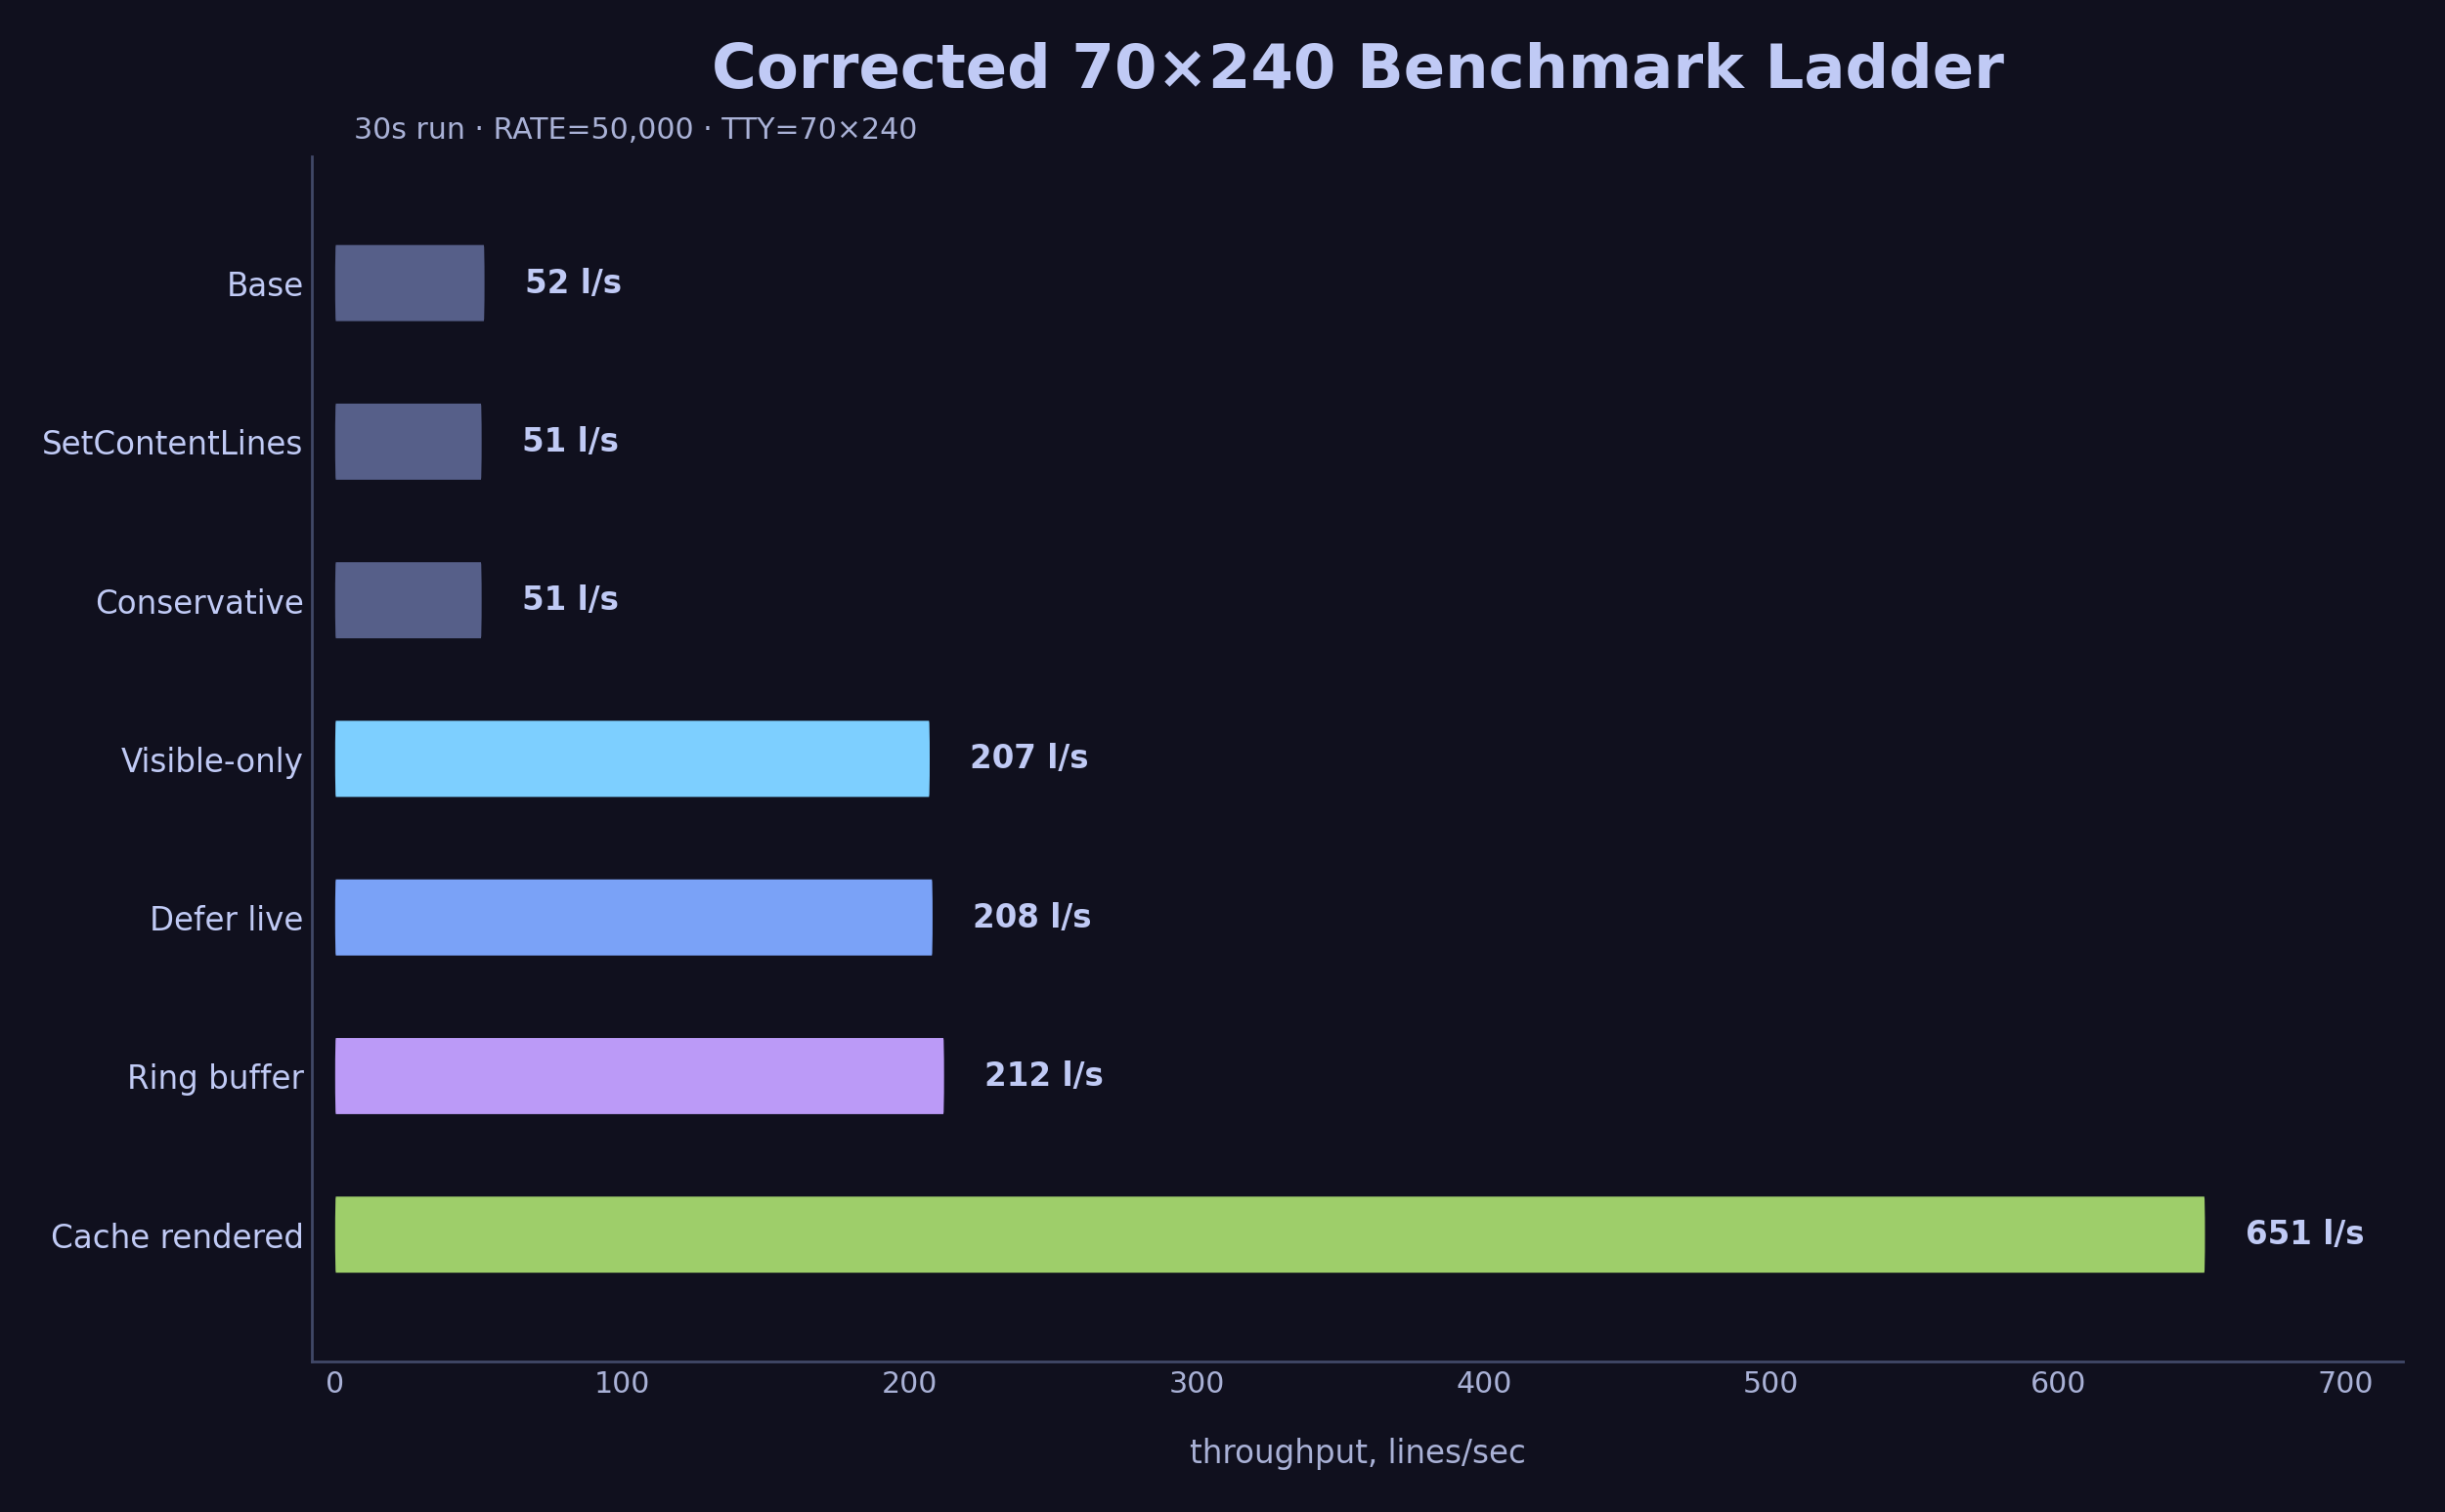
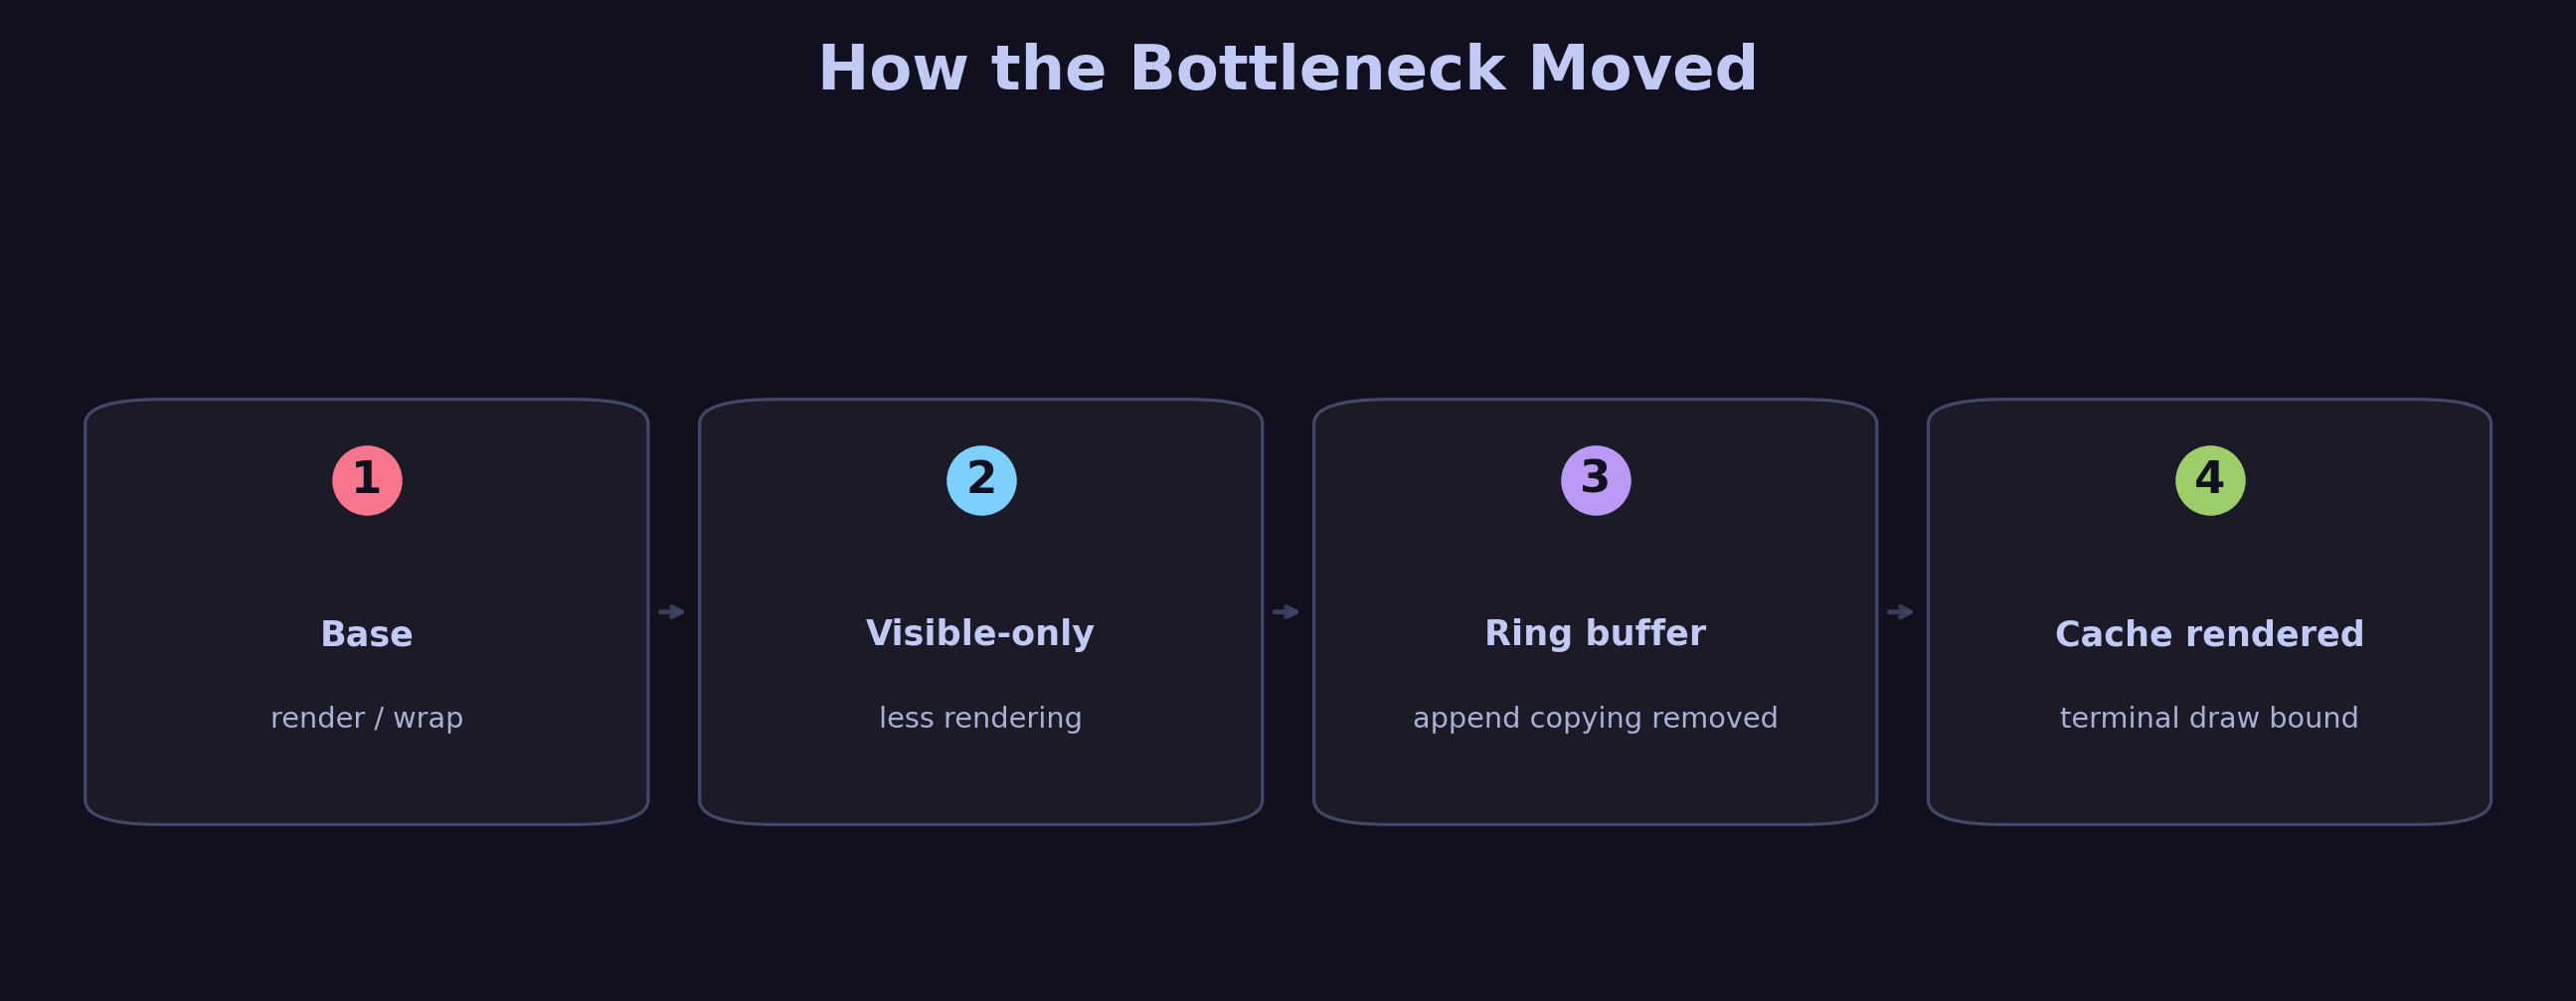
I built Peacock, a terminal JSON log viewer in Go, and it was too slow to keep up with a busy log stream. This post is a step-by-step go tool pprof walkthrough: read the profile, fix the hottest line, re-profile, repeat. On a real 70×240 terminal, throughput went from 52 l/s to 651 l/s, about 12×.
It also covers the evening I lost chasing a bug in my own benchmark. That bug taught me more than any single optimization.
What is Peacock?
Peacock is a terminal UI for viewing JSON logs. You pipe logs into it, and it parses them, colors them, wraps long lines, and lets you filter and scroll. It is built with Go and Bubble Tea, a TUI framework, plus Lipgloss, a styling library that applies ANSI colors and word-wraps strings to fit a terminal width.
When I piped a real production microservice into it, the UI stuttered. Logs arrived faster than Peacock could process them. So I wrote a stress-test benchmark and started profiling.
The hot path looked like this:

Two details matter for the rest of the post. A viewport is the scrollable window that Bubble Tea draws into the terminal. ANSI styling and word wrapping depend on terminal width, so a fake or broken terminal size can change the amount of work Peacock does.
The Benchmark Setup
The benchmark has two parts: a log generator and Peacock itself.
The generator (testdata/stress-test/main.go) produces randomized JSON log lines at a configurable rate. Peacock reads them from stdin, parses them, and renders them in a scrollable viewport.
Peacock is a TUI. It queries the terminal for dimensions using ioctl, so a plain pipe would make it think there is no terminal at all. The benchmark wraps everything in a pseudo-TTY using the Unix script(1) command:
(sleep "$STOP_AFTER"; printf '\003') \
  | script -q -e -f -c 'bash -o pipefail -c "$PIPELINE"' "$TTY_LOG"
The pipeline inside is:
go run "$ROOT_DIR/testdata/stress-test/main.go" \
  -rate "$RATE" \
  -duration "$DURATION" \
  -seed "$SEED" \
  | tee >(wc -l > "$LINE_COUNT") \
  | TERM=xterm-256color "$PEACOCK_BIN" --cpuprofile "$CPU_PROFILE"
A background timer sends Ctrl+C after the test duration. The --cpuprofile flag tells Peacock to write a CPU profile to disk. We will use that profile with go tool pprof.
How throughput is measured: tee splits the stream. One branch goes to wc -l, which writes the line count to processed-lines.txt. After the run, lines ÷ duration = throughput. If Peacock is slow, the pipe applies backpressure and fewer lines are processed.
I ran these benchmarks on my machine:
| Field | Value |
|---|---|
| CPU | AMD Ryzen 7 5800HS, 8 cores / 16 threads |
| OS | Linux 6.6.114.1-microsoft-standard-WSL2, x86_64 |
| Go | go1.26.3 linux/amd64 |
| Peacock branch | benchmark-optimization-ladder |
| Peacock commit | 74e081b |
| Benchmark script | scripts/benchmark-stress.sh |
| Generator | testdata/stress-test/main.go |
| Seed | 1 |
| Input rate | 50,000 lines/sec |
| Corrected terminal size | 70×240 |
The benchmark measures the whole pipeline around Peacock: generator, pipe, pseudo-TTY, terminal writes, and profiling overhead. That makes it useful as a stress test, but it also means the environment can lie to you.
The benchmark counts generated lines with tee, then sends the same stream into Peacock. Backpressure from a slow consumer shows up directly in the line count.
What is pprof?
go tool pprof is Go’s built-in profiler. When you enable CPU profiling, the Go runtime samples what the CPU is doing about 100 times per second. Each sample records the current call stack. After the program finishes, pprof aggregates these samples and tells you which functions consumed the most time.
There are two ways to look at the data:
- Flat time: how much time was spent inside this function itself.
- Cumulative time: how much time was spent inside this function plus everything it called.
We will use three pprof commands. Build the binary with debug symbols first so pprof can resolve them:
go build -o peacock-binary ./cmd/peacock
Then:
# Top functions by cumulative time
go tool pprof -top -cum profile.prof

# Show the call tree around a specific function
go tool pprof -focus="FunctionName" -tree profile.prof

# Show source code lines annotated with CPU time
go tool pprof -list="FunctionName" peacock-binary profile.prof
The -list command is the most useful one. It prints the actual source code of a function, with two extra columns on the left: flat time and cumulative time spent on each line. This tells you exactly which line is eating the CPU.
In the snippets below, the left columns are the important part. The first number is flat time. The second number is cumulative time. When one source line has a large cumulative value, that line is calling expensive work.
Read pprof -list from left to right: flat time, cumulative time, then the source line that caused it.
One note on reading the percentages below. Each capture in this post is its own profile: the base run, the post-fix run, and a few focused runs on single functions. The % of Total column is relative to the capture that produced it, so an 85% line from a focused profile and an 8% line from the full base run rest on different denominators. Inside a single snippet, the per-line flat and cumulative columns carry the signal. When the same function shows up in more than one capture, the useful comparison is how its shape changes, since the headline percentage moves with the denominator.
Cleanup: The SetContent Surprise
While reading the base profile, I noticed something odd:
go tool pprof -top -cum base.prof
     0     0%     0%     29.66s  8.00%  charm.land/bubbles/v2/viewport.(*Model).SetContent
  0.02s 0.005%     0%     29.30s  7.90%  strings.Split (inline)
  8.12s  2.19%     0%     29.28s  7.90%  strings.genSplit
SetContent is a viewport setter. Why is it eating 8% of total CPU? I used -list to look at the source:
go tool pprof -list="SetContent" peacock-binary base.prof
ROUTINE ======================== charm.land/bubbles/v2/viewport.(*Model).SetContent
         0     29.66s (flat, cum)  8.00% of Total
         .          .    226:func (m *Model) SetContent(s string) {
         .     29.66s    227:    m.SetContentLines(strings.Split(s, "\n"))
         .          .    228:}
Line 227 shows 29.66 seconds cumulative. The method takes a single string, splits it on \n into a []string, and then calls SetContentLines. Peacock already had the lines as a []string. In syncViewport, it was joining them back into one giant string with lipgloss.JoinVertical, just so SetContent could split them again.
Replacing JoinVertical plus SetContent with SetContentLines removed a join/split round trip.
I checked the caller with -list in a shorter focused profile:
go tool pprof -list="syncViewport" peacock-binary base.prof
ROUTINE ======================== github.com/dubeyKartikay/peacock/internal/tui.model.syncViewport
         0     10.26s (flat, cum) 85.00% of Total
         .          .    145:func (m model) syncViewport(stickBottom bool) model {
         .      8.07s    146:    content := m.contentLines()
         .          .    147:    contentHeight := m.totalHeight()
         .          .    148:    contentWidth := max(minViewportDimension, m.width-m.styles.panel.GetHorizontalFrameSize())
         .          .    149:    m.viewport.SetWidth(contentWidth)
         .          .    150:    m.viewport.SetHeight(contentHeight)
         .          .    151:    m.filterInput.SetWidth(...)
         .      2.19s    152:    m.viewport.SetContent(lipgloss.JoinVertical(lipgloss.Left, content...))
         .          .    153:    if stickBottom {
         .          .    154:        m.viewport.GotoBottom()
         .          .    155:    }
Line 152 shows 2.19 seconds on the SetContent call inside syncViewport. This snippet is the focused profile, so its 85% baseline differs from the base-profile numbers above, as noted earlier. The waste is identical: JoinVertical joins the slice into a string, and SetContent splits it back into a slice.
I replaced it with a direct call to SetContentLines:
// Before
m.viewport.SetContent(lipgloss.JoinVertical(lipgloss.Left, content...))

// After
m.viewport.SetContentLines(content)
After the fix, I checked the profile again:
go tool pprof -list="SetContentLines" peacock-binary after.prof
ROUTINE ======================== charm.land/bubbles/v2/viewport.(*Model).SetContentLines
      10ms      270ms (flat, cum)  1.55% of Total
         .          .    233:func (m *Model) SetContentLines(lines []string) {
         .          .    234:    // if there's no content, set content to actual nil instead of one empty
         .          .    235:    // line.
         .          .    236:    m.lines = lines
         .       20ms    237:    if len(m.lines) == 1 && ansi.StringWidth(m.lines[0]) == 0 {
         .          .    238:        m.lines = nil
The viewport content-setting time dropped from 2.19 seconds to roughly 270 milliseconds. The strings.Split and strings.genSplit overhead vanished entirely.
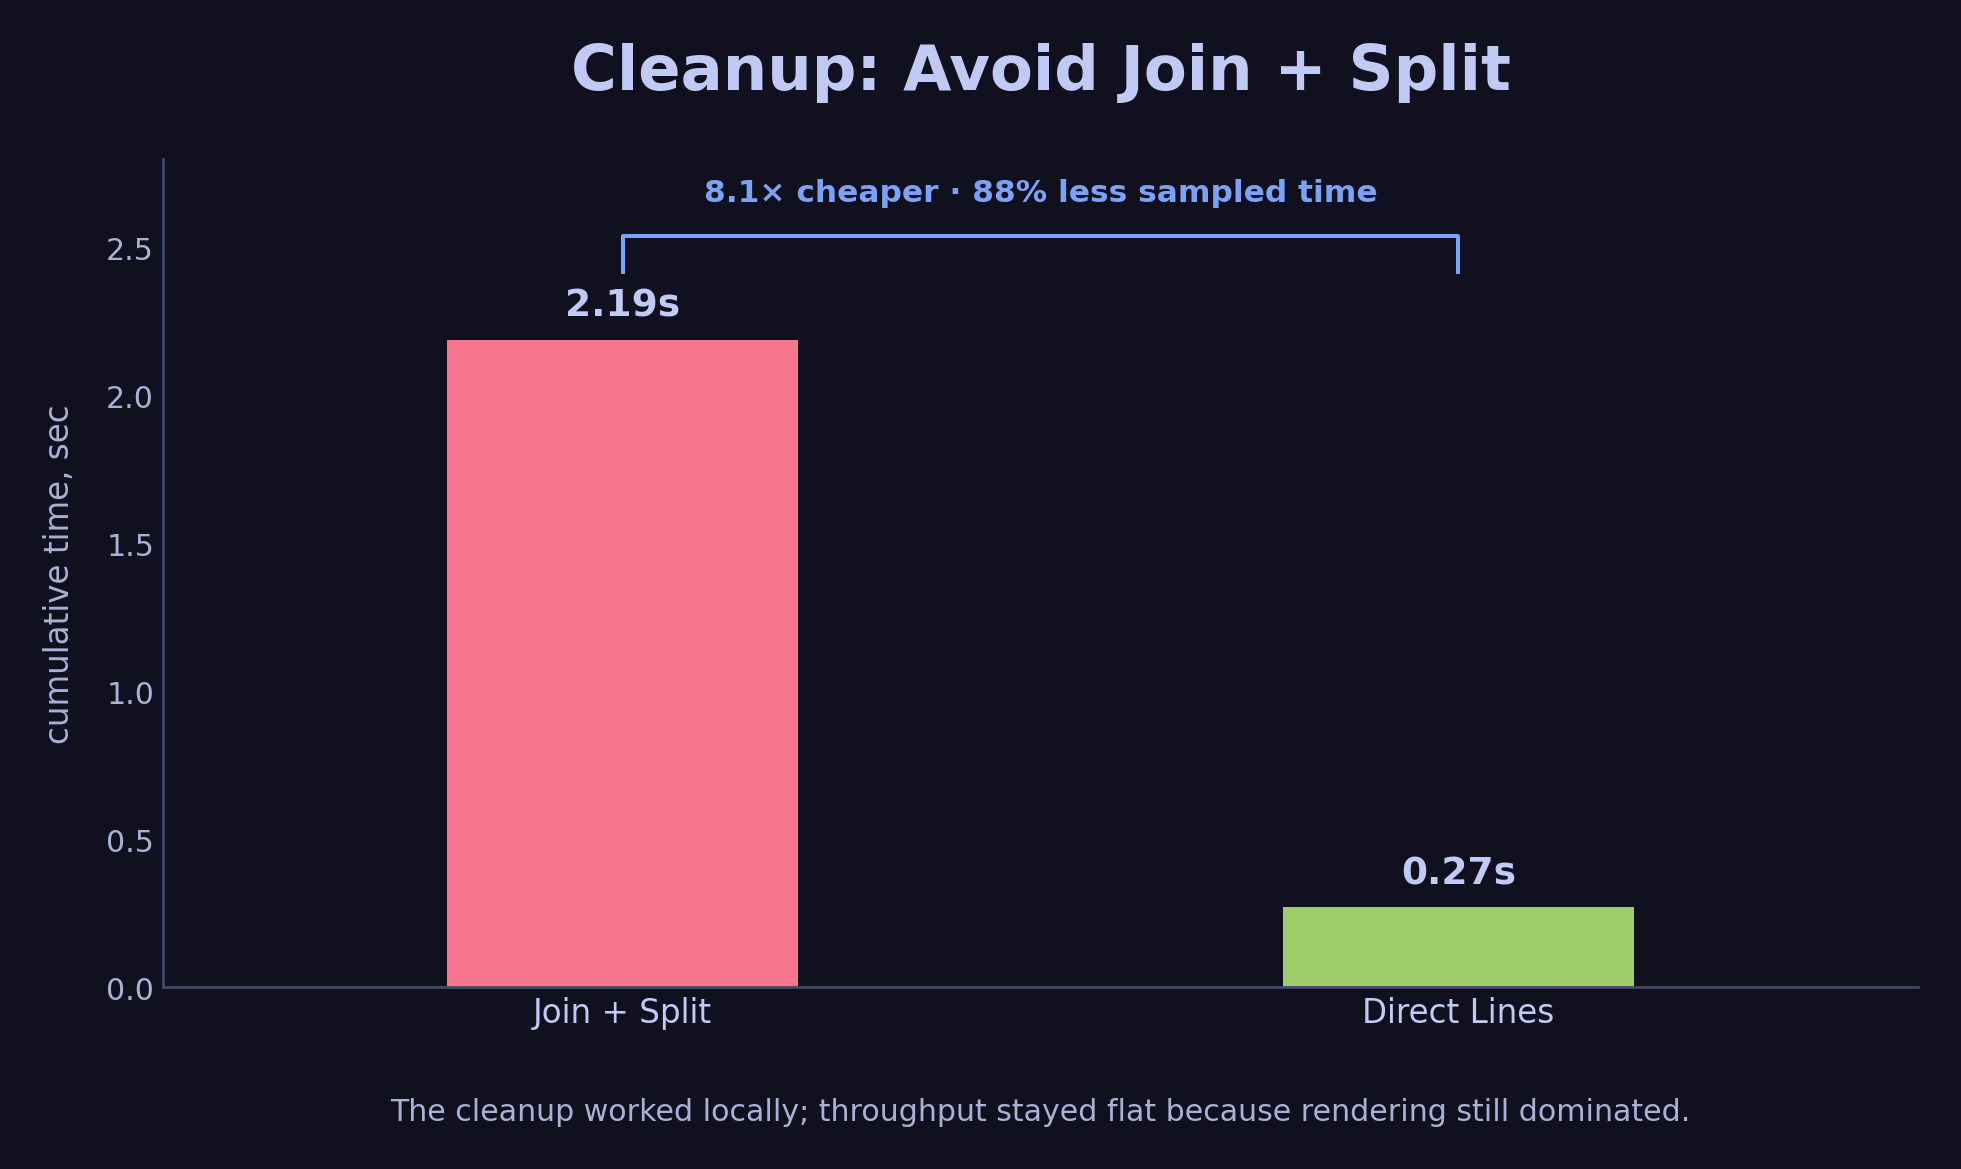
The content-setting path got much cheaper. Rendering still dominated the benchmark.
When I re-ran the benchmark, throughput barely moved. In the still-buggy benchmark environment the base ran at 9 lines/sec, and the cleanup left it in the same single-digit range. SetContent was 8% of the profile. renderEntry was 63%. I had cleaned up a real inefficiency, and the largest cost was still elsewhere.
Optimization 2: Rendering the Entire Backlog
The largest cost was contentLines. Here is the relevant profile:
go tool pprof -list="contentLines" peacock-binary base.prof
Output:
ROUTINE ======================== github.com/dubeyKartikay/peacock/internal/tui.(*model).contentLines
      80ms      8.07s (flat, cum) 66.86% of Total
         .          .    123:func (m *model) contentLines() []string {
         .          .    124:    width := max(minViewportDimension, m.width-m.styles.panel.GetHorizontalFrameSize())
         .          .    125:
         .          .    126:    m.visibleEntries = m.filteredEntryIndexes()
         .          .    127:
         .          .    128:    lines := make([]string, 0, len(m.visibleEntries))
         .          .    129:    for index := range m.visibleEntries {
      70ms      8.06s    130:        rendered, renderedHeight := m.styles.renderEntry(m.visibleEntries[index], width)
      10ms       10ms    131:        m.visibleEntries[index].SetRenderHeight(renderedHeight)
         .          .    132:        lines = append(lines, rendered)
         .          .    133:    }
         .          .    134:    return lines
         .          .    135:}
Line 130 shows 8.06 seconds cumulative. That single line calls renderEntry for every entry in visibleEntries. filteredEntryIndexes returns the whole buffered backlog, including entries far outside the viewport.
The optimized path renders only the backlog entries that can appear in the viewport.
Even though the terminal can only display about 70 lines, Peacock was Lipgloss-rendering and word-wrapping the entire backlog on every frame.
The fix was to cap the number of entries to the viewport height. Since each entry takes at least one row, at most m.height entries can ever be visible. I added a limit parameter and a helper called liveEntryLimit:
func (m model) liveEntryLimit() int {
    return max(minViewportDimension, m.height-m.styles.panel.GetVerticalFrameSize())
}
minViewportDimension is a constant set to 1, so the limit is always at least one line.
func (m model) filteredEntries(limit int) []*logs.Entry {
    maxEntries := m.inBufferEntries.Len()
    if limit > 0 {
        maxEntries = min(maxEntries, limit)
    }
    filtered := make([]*logs.Entry, 0, maxEntries)

    if len(m.filters) == 0 {
        return append(filtered, m.inBufferEntries.Newest(limit)...)
    }

    m.inBufferEntries.ReverseRange(func(entry *logs.Entry) bool {
        if limit > 0 && len(filtered) >= limit {
            return false
        }
        for _, filter := range m.filters {
            if !strings.Contains(entry.Search, filter) {
                return true
            }
        }
        filtered = append(filtered, entry)
        return true
    })
    slices.Reverse(filtered)
    return filtered
}
syncViewport now passes the limit down:
func (m *model) syncViewport(stickBottom bool) {
    contentWidth := max(minViewportDimension, m.width-m.styles.panel.GetHorizontalFrameSize())
    contentLimit := m.liveEntryLimit()
    if m.paused {
        contentLimit = 0
    }
    content := m.contentLines(contentLimit)
    ...
}
The bound check is easy to get wrong. I want limit == 0 to mean “no limit” for paused or full-history paths. For positive limits, the loop stops only after it has collected exactly limit matching entries.
After this change, I re-ran the benchmark and checked the profile:
go tool pprof -list="contentLines" peacock-binary visible.prof
Output:
ROUTINE ======================== github.com/dubeyKartikay/peacock/internal/tui.(*model).contentLines
      80ms      2.46s (flat, cum) 14.11% of Total
         .          .    135:func (m *model) contentLines(limit int) []string {
         .          .    136:    width := max(minViewportDimension, m.width-m.styles.panel.GetHorizontalFrameSize())
         .          .    137:
      60ms       70ms    138:    m.visibleEntries = m.filteredEntries(limit)
         .          .    139:
         .       10ms    140:    lines := make([]string, 0, len(m.visibleEntries))
         .          .    141:    for index := range m.visibleEntries {
      10ms      2.35s    142:        rendered, renderedHeight := m.styles.renderEntry(m.visibleEntries[index], width)
      10ms       10ms    143:        m.visibleEntries[index].SetRenderHeight(renderedHeight)
         .          .    144:        lines = append(lines, rendered)
         .          .    145:    }
         .          .    146:    return lines
Line 142 dropped from 8.06s to 2.35s. The cumulative time for contentLines dropped from 66.86% to 14.11%, and throughput in the buggy 0×0 benchmark jumped from 9 lines/sec to 1,712 lines/sec.
The source line is the same shape and now runs for far fewer entries.
Optimization 3: The Ring Buffer
With visible-only rendering in place, the flat profile shifted:
go tool pprof -top visible.prof
  flat  flat%
92.17s 16.43%  runtime.memmove
78.68s 14.03%  runtime.memclrNoHeapPointers
46.75s  8.34%  runtime.futex
41.53s  7.41%  runtime.tryDeferToSpanScan
The flat profile had shifted into Go runtime memory work. I traced the appendEntry path:
go tool pprof -focus="appendEntry" -tree visible.prof
                                             87.65s   100% |   runtime.typedslicecopy
    87.65s 15.63% 15.63%     87.65s 15.63%  | runtime.memmove
                                             74.57s   100% |   runtime.memclrNoHeapPointersChunked
    74.58s 13.30% 28.93%     74.58s 13.30%  | runtime.memclrNoHeapPointers
                                             53.07s   100% |   runtime.typedslicecopy
    10.82s  1.93% 33.53%     53.07s  9.46%  | runtime.bulkBarrierPreWrite
                                            36.60s 68.97% |   runtime.(*wbBuf).get2
appendEntry was 39% of total CPU. The code looked like this:
func (m model) appendEntry(entries ...logs.Entry) model {
    m.inBufferEntries = append(m.inBufferEntries, entries...)
    if len(m.inBufferEntries) > m.cfg.Buffer.MaxEntries {
        trim := len(m.inBufferEntries) - m.cfg.Buffer.MaxEntries
        m.inBufferEntries = append([]logs.Entry(nil), m.inBufferEntries[trim:]...)
    }
    return m
}
Every append could trigger growslice → typedslicecopy → memmove. When over capacity, it allocated a brand new slice and copied survivors. The old arrays became garbage. GC had to scan and free them.
logs.Entry is a struct value type that contains string fields. When typedslicecopy runs, it copies every Entry struct, which means copying every string header (pointer, length, capacity) across the slices. The more entries, the more memmove churn.
The CPU profile alone was enough to justify this change. If I wanted to quantify the allocation side, the next command would be go tool pprof -alloc_space, but I did not need it to find the bottleneck here.
Slice trimming allocates and copies survivors. A ring buffer overwrites in place and advances the start pointer.
I replaced the slice with a fixed-size circular buffer:
type entryRing struct {
    entries []logs.Entry
    start   int
    size    int
}

func (r *entryRing) Append(entry logs.Entry) {
    if r.size == len(r.entries) {
        r.entries[r.start] = entry
        r.start = (r.start + 1) % len(r.entries)
        return
    }
    index := (r.start + r.size) % len(r.entries)
    r.entries[index] = entry
    r.size++
}

func (r *entryRing) AppendBatch(batch []logs.Entry) {
    if len(batch) >= len(r.entries) {
        batch = batch[len(batch)-len(r.entries):]
        copy(r.entries, batch)
        r.start = 0
        r.size = len(batch)
        return
    }
    for _, entry := range batch {
        r.Append(entry)
    }
}
The model now uses entryRing instead of []logs.Entry:
func (m model) appendEntry(entries ...logs.Entry) model {
    m.inBufferEntries.AppendBatch(entries)
    return m
}
AppendBatch handles the common case of many incoming entries efficiently. If the batch is larger than the whole ring, it keeps only the newest entries and copies them directly into the backing array. Otherwise it walks the batch and appends each entry in place.
The invariants are small enough to keep in your head:
startpoints at the oldest live entry.sizeis the number of live entries, capped atlen(entries).At(i)maps logical order to physical array index with(start + i) % len(entries).- When the ring is full,
Appendoverwritesentries[start]and advancesstartby one. Newest(n)returns pointers in oldest-to-newest order for the newestnentries.
That last point matters because the renderer expects stable display order. The ring can overwrite an old entry, but it never reorders the live window.
After the ring buffer, appendEntry disappeared from the profile entirely. memmove fell from 92 seconds to 10 seconds. In the still-buggy 0×0 benchmark, throughput went from 1,712 l/s to 6,095 l/s.
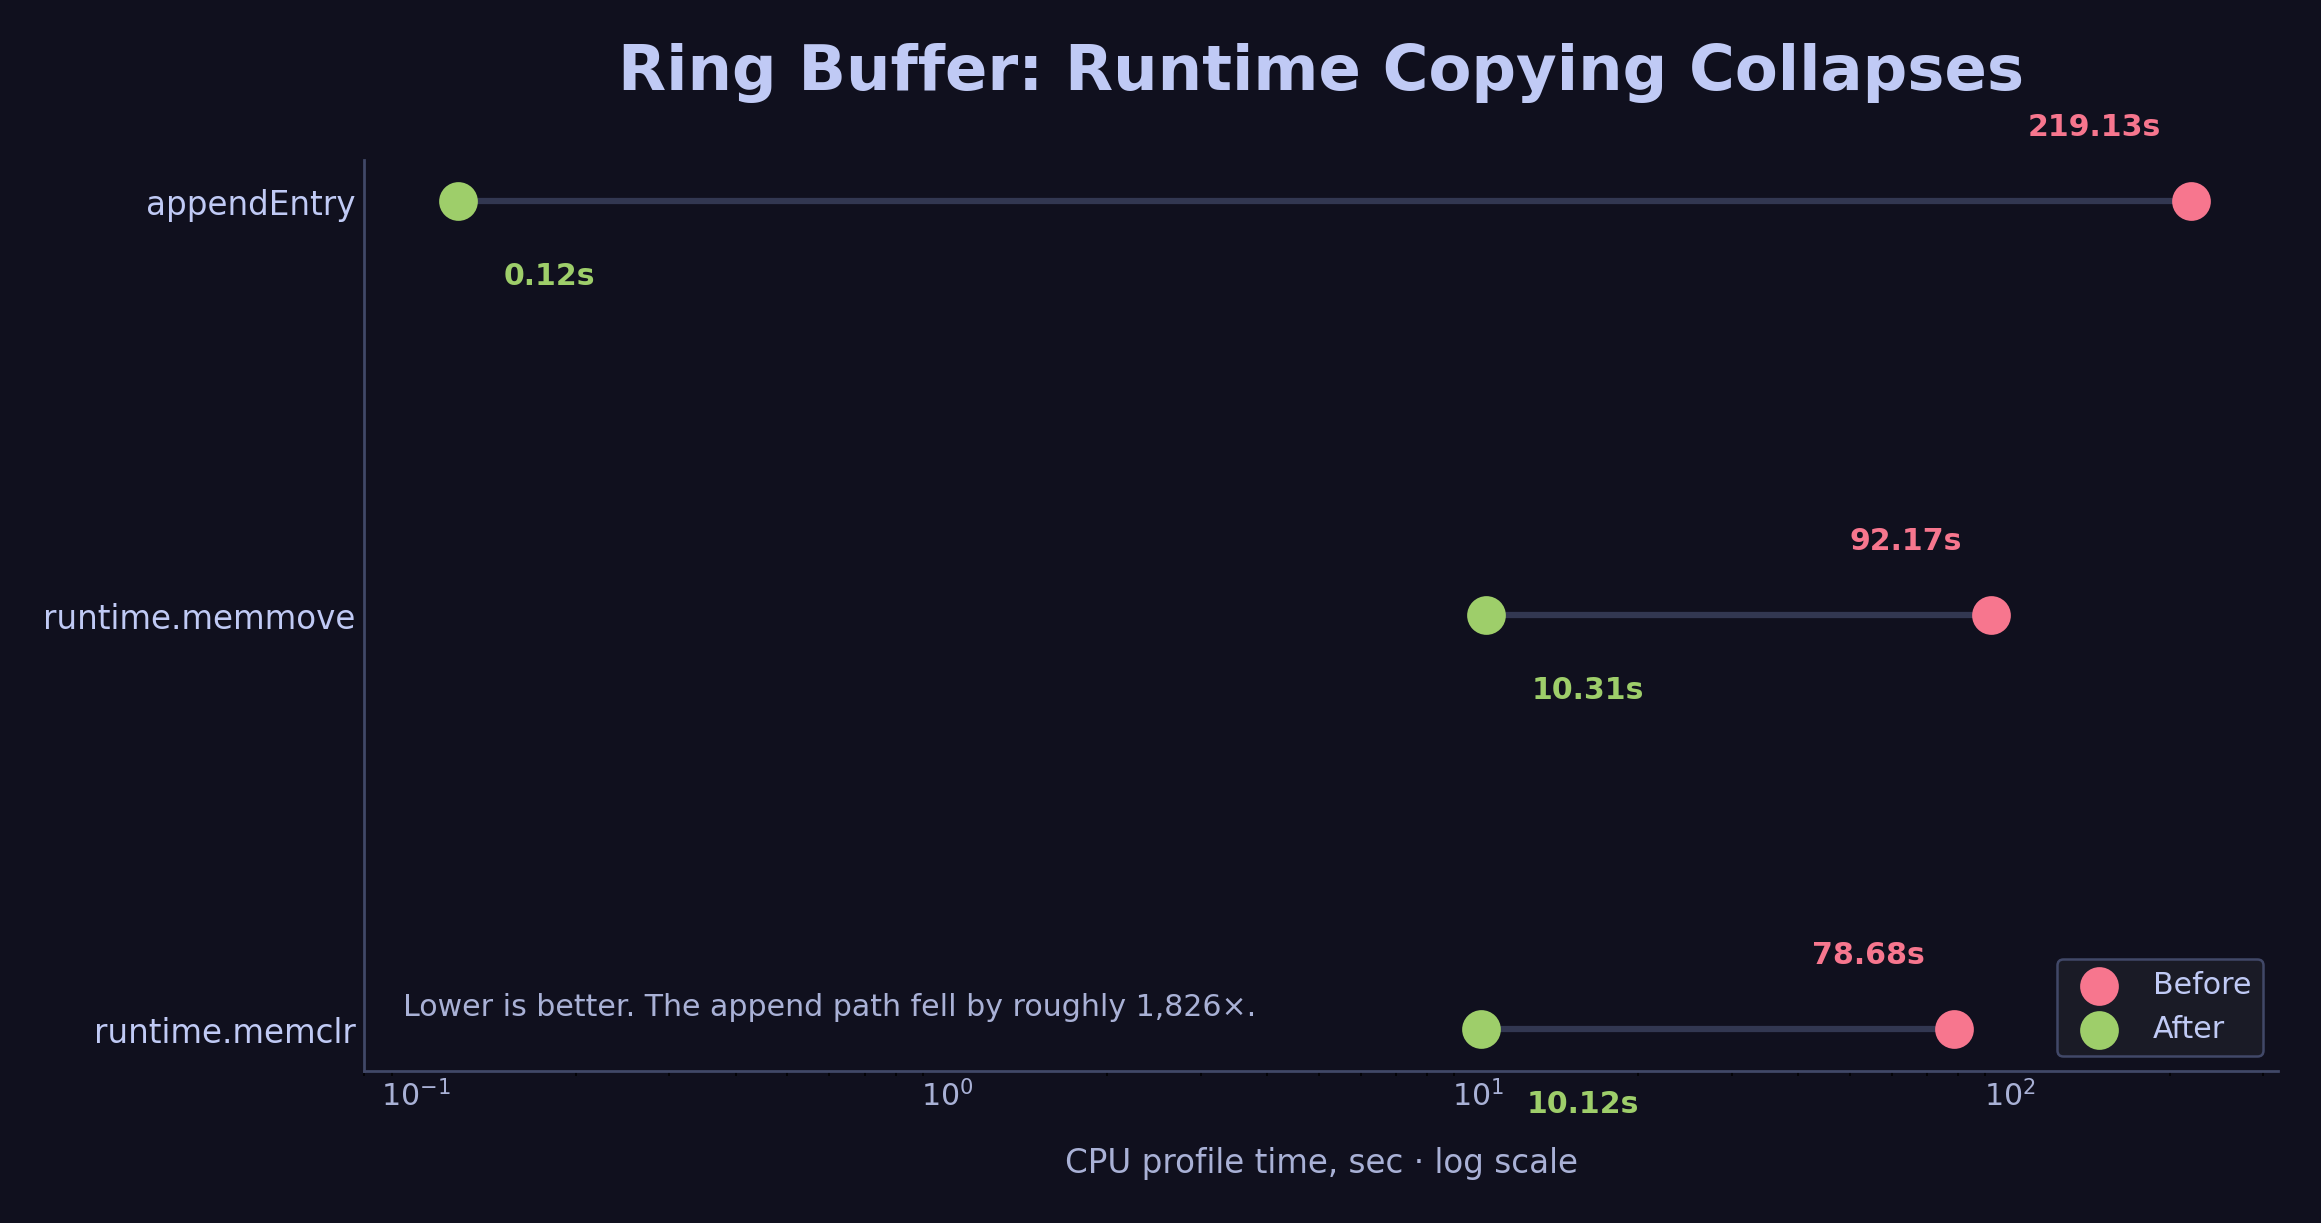
The ring buffer removes the slice-copying path. appendEntry falls from 219s to 0.12s in the profile.
You might wonder about runtime.futex at 8.34% in the earlier flat profile. That is the Go scheduler parking goroutines while the main thread waits on the pseudo-TTY. It comes from the benchmark’s script(1) I/O path and drops in a real interactive terminal.
The Cache Rendered Confusion
After the ring buffer, renderEntry → wordwrap was still at the top of the cumulative profile. The idea was simple: cache the final rendered string of each entry so we never recompute it.
type Entry struct {
    Raw           string
    ...
    rendered      bool
    renderedText  string
    renderHeight  int
    viewportWidth int
}

func (e *Entry) CacheRenderedString(viewportWidth int, rendered string, height int) {
    e.rendered = true
    e.renderedText = rendered
    e.renderHeight = height
    e.viewportWidth = viewportWidth
}

func (e Entry) GetCachedRender(viewportWidth int) (string, bool) {
    if e.rendered && e.viewportWidth == viewportWidth {
        return e.renderedText, true
    }
    return "", false
}
The cache invalidates implicitly. The key is the viewportWidth. When the terminal resizes, the width changes, so GetCachedRender returns a miss and renderEntry recomputes. No explicit invalidation logic is needed because the width check handles it.
func (s styles) renderEntry(entry *logs.Entry, width int) string {
    if cached, ok := entry.GetCachedRender(width); ok {
        return cached
    }
    // ... expensive lipgloss + wordwrap work ...
    entry.CacheRenderedString(width, view, lipgloss.Height(view))
    return view
}
I ran the benchmark. The result:
The cache avoids recomputing rendered strings for entries already seen at the same viewport width.
Ring buffer: 1,829,171 lines, 6,095 l/s
Cache rendered: 1,828,989 lines, 6,095 l/s
The cache optimization showed zero improvement.
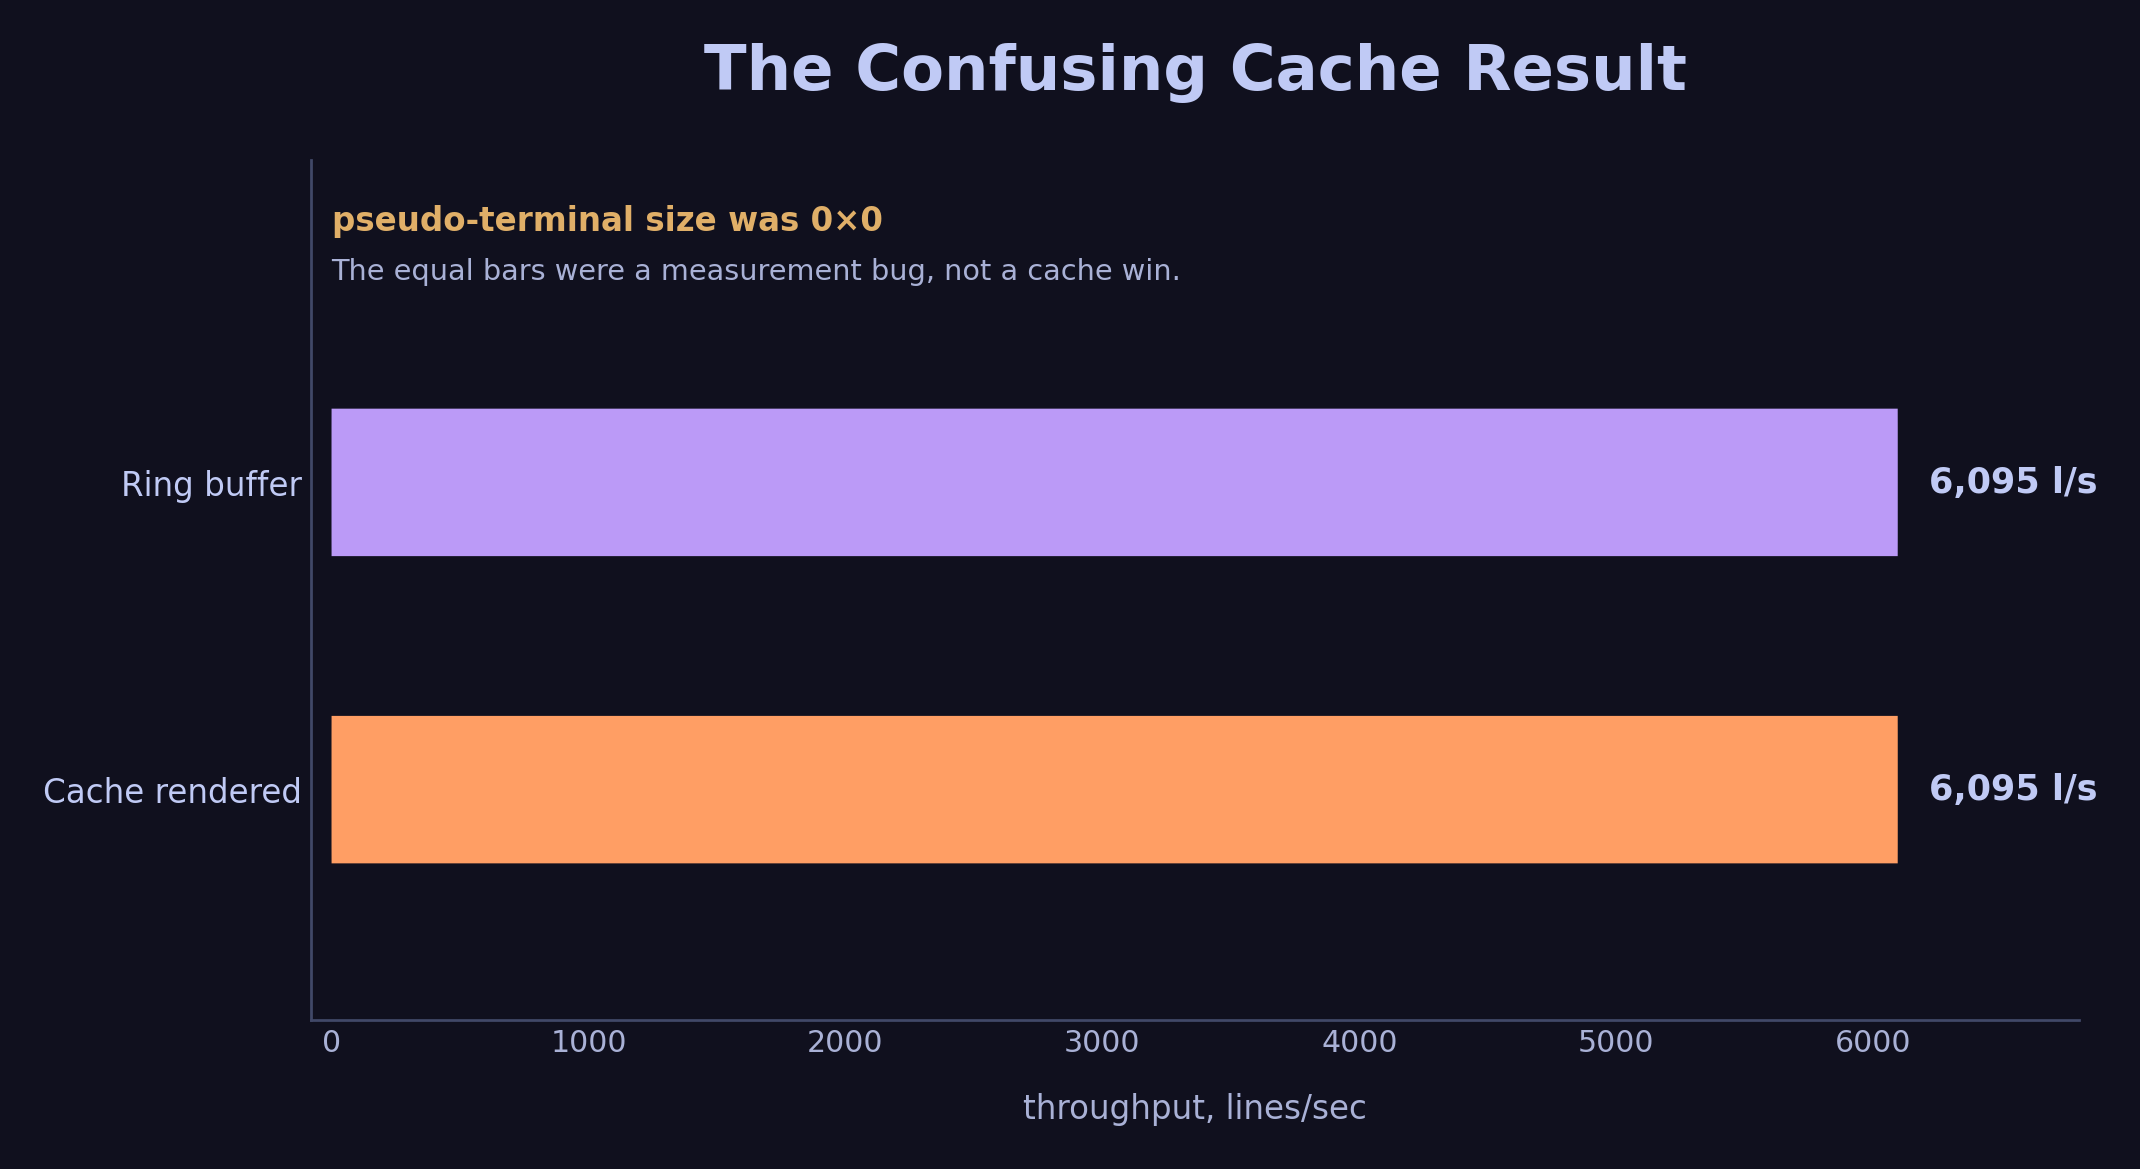
This result was the clue. A cache that should have helped showed exactly the same throughput.
The profile looked almost identical to the ring buffer run, so I checked the -list output:
go tool pprof -list="renderEntry" peacock-binary cache.prof
Output:
ROUTINE ======================== github.com/dubeyKartikay/peacock/internal/tui.styles.renderEntry
     140ms      6.32s (flat, cum) 46.64% of Total
         .          .     78:func (s styles) renderEntry(entry *logs.Entry, width int) string {
         .          .     79:    if cached, ok := entry.GetCachedRender(width); ok {
         .          .     80:        return cached
         .          .     81:    }
         .          .     82:    if !entry.Parsed {
         .          .     83:        entry.CacheRenderedString(width, entry.Raw, lipgloss.Height(entry.Raw))
         .          .     84:        return entry.Raw
         .          .     85:    }
         .          .     86:    logMetadata := ""
         .          .     87:    content := ""
         .          .     88:
       20ms      380ms     89:    logMetadata = lipgloss.JoinHorizontal(lipgloss.Left, logMetadata, s.renderPart(entry.Timestamp))
       10ms      190ms     90:    logMetadata = lipgloss.JoinHorizontal(lipgloss.Left, logMetadata, s.renderPart(entry.Level))
       50ms      310ms     92:    content = lipgloss.JoinHorizontal(lipgloss.Left, content, s.renderPart(entry.Message))
       30ms      270ms     93:    content = lipgloss.JoinHorizontal(lipgloss.Left, content, s.renderPart(entry.Caller))
       30ms      480ms     94:    content = lipgloss.JoinHorizontal(lipgloss.Left, content, s.renderPart(entry.Context))
         .          .     95:
         .      4.69s     96:    view := logs.WrapHorizontalOverflow(logMetadata, content, width)
         .          .     97:    entry.CacheRenderedString(width, view, lipgloss.Height(view))
         .          .     98:    return view
Lines 79-80 show zero time. That means the cache was hitting. Lines 89-96 still show time from calls that miss (new entries being rendered for the first time). That is expected.
So why did throughput not improve? The cache should have eliminated re-rendering of existing entries.
I checked the terminal dimensions next. Peacock uses lipgloss.Height and word-wrap based on terminal width. What does the pseudo-TTY actually report?
I ran a test inside the benchmark script:
$ script -q -c 'tput lines; tput cols' /dev/null
0
0
The pseudo-terminal had no dimensions. That erased most of the word-wrap work, so the cache optimization had almost nothing to skip.
In this benchmark environment, script without explicit dimensions opened a pseudo-terminal at 0 rows × 0 columns.
This means word-wrap width was 0. Peacock’s WrapHorizontalOverflow checks maxWidth <= 0 and returns early, so the benchmark skipped the expensive part of rendering: wrapping, measuring rune width, and building the final multi-line view. The cache had little useful work to skip.
Visible-only rendering had helped because it reduced the number of lines passed to the viewport, and the viewport still does per-line work. Caching the rendered string had little room to help when rendering was already trivial.
The real rendering cost, including word-wrap, ANSI styling, and rune-width calculation, only happens when the terminal has a real, non-zero width.
Fixing the Script
I added explicit terminal dimensions to the script invocation:
TTY_ROWS="${TTY_ROWS:-70}"
TTY_COLS="${TTY_COLS:-240}"

(sleep "$STOP_AFTER"; printf '\003') \
  | script -q -e -f -c \
    'stty rows "$TTY_ROWS" cols "$TTY_COLS"; export LINES="$TTY_ROWS" COLUMNS="$TTY_COLS"; bash -o pipefail -c "$PIPELINE"' \
    "$TTY_LOG"
stty rows and stty cols set the kernel TTY dimensions. LINES and COLUMNS are exported so Lipgloss picks them up as environment fallbacks when ioctl returns zero or when running under emulators. Terminal size detection works in layers: kernel TTY first, then environment variables, then library defaults. I needed both fixes because script was failing at the kernel layer, and some libraries check the environment before falling back.
The Corrected Numbers
With the script fixed, I re-ran the full ladder:
30-second runs (70×240 terminal)
| Step | Lines | Throughput |
|---|---|---|
| Base | 1,584 | 52 l/s |
| Visible-only rendering | 6,338 | 207 l/s |
| Ring buffer | 6,495 | 212 l/s |
| Cache rendered | 19,572 | 651 l/s |
5-minute runs (70×240 terminal)
| Step | Lines | Throughput |
|---|---|---|
| Base | 3,894 | 12 l/s |
| Visible-only rendering | 54,808 | 182 l/s |
| Ring buffer | 56,197 | 186 l/s |
| Cache rendered | 181,625 | 605 l/s |
With real terminal dimensions, cache rendered entries added a 3× jump on top of the ring buffer.
One honest note on the ring buffer. On a corrected terminal it moved throughput from 207 to 212 l/s, which is inside the noise. Its payoff is steadier memory use and lower GC pressure over long runs, and a 30-second benchmark does not stress that. The large 6,095 l/s figure belonged to the broken 0×0 environment, where rendering was disabled and the slice-copy path accounted for most of the remaining work.
I did not keep a separate corrected run for the SetContentLines cleanup alone. The profile showed that the join/split path got cheaper. The corrected throughput ladder starts at the larger checkpoints I reran after fixing the terminal size.
After fixing the terminal size, cache rendered entries finally show the expected jump.
What the pprof Says After Each Step
Base: contentLines → renderEntry → wordwrap → go-runewidth.RuneWidth dominates. Every frame, every buffered entry, every grapheme.
After visible-only: contentLines cumulative drops from 66.86% to 14.11%, the same figures the -list output showed earlier. Rendering is bounded to the entries that fit on screen.
After ring buffer: appendEntry → typedslicecopy → memmove disappears. The flat profile shifts from runtime memory operations back to rendering functions.
After cache rendered (real terminal): contentLines drops to 4.5%. The cumulative profile shows ansi.stringWidth and parser transitions at the top. The bottleneck moved from entry rendering to actual terminal drawing work. Peacock is now fast enough that the remaining CPU cost is pushing pixels through the pseudo-TTY.
Each optimization exposes the next bottleneck. That is the main pprof lesson in this post.
How to Read pprof
- Start with
-top -cumto find the high-level bottleneck. Look for functions in your own code. If a library function stands out, look at its caller. - Use
-focusand-treeto trace the call path. See which parent function is calling the expensive child. - Use
-listto see annotated source lines. This is where the real discovery happens. A single line with 8 seconds of cumulative time deserves the first inspection. - Check flat vs cumulative. High cumulative + low flat means the function is a coordinator that calls expensive children. High flat means the function itself is doing heavy work.
- Verify with benchmarks. A profile tells you where time goes. A benchmark tells you if the fix worked. Measure throughput alongside CPU samples.
- Distrust your environment. A profile measures whatever the harness actually ran. Confirm the benchmark reflects real conditions before you trust a flat result.
Correctness checks
The performance changes touched stateful code, so I checked the behavior with tests instead of trusting the benchmark alone. The important cases were ring-buffer eviction order, pause/resume buffering, queued entry flushing, and literal substring filtering. The ring-buffer test appends four entries into a capacity-three buffer and expects second, third, fourth in that order.
The cache also has a simple correctness rule: a rendered string is valid only for the viewport width it was built with. When the width changes, GetCachedRender(width) misses and Peacock renders the entry again. That keeps terminal resize behavior correct without a separate invalidation pass.
Final Lessons
The biggest wins are algorithmic. Visible-only rendering bounded each frame to roughly the terminal height. That beats every string-allocation trick.
Your benchmark script is part of the system. I spent a couple of evenings convinced my cache implementation was broken. I re-read the GetCachedRender logic three times, added debug prints, and checked for race conditions. The real bug lived in benchmark-stress.sh: a script -q call with no explicit dimensions opened a 0×0 terminal and silently neutralized the optimization. When an optimization shows zero improvement, the instinct is to question its correctness. The measurement deserves the first look.
Know when to stop. After visible-only rendering, Peacock was already fast enough for production. That single change carried the practical win. I kept going into the ring buffer and the render cache out of curiosity about how fast Peacock could get, well past the point where it mattered for production.
The 651 l/s number is a lower bound. In a real interactive terminal, without script writing to a log file, the I/O overhead from the pseudo-TTY drops and throughput is likely higher. The benchmark measures the whole system around the code.
The code is in the repo. The benchmark script is scripts/benchmark-stress.sh. The synthetic log generator is testdata/stress-test/. The ladder branch is benchmark-optimization-ladder.